D3.js in Action: Data visualization with JavaScript
SKU: 1617294489 (Updated 2023-01-11)
Price:
US$ 38.42
Description
Summary
D3.js in Action, Second Edition is completely revised and updated for D3 v4 and ES6. It's a practical tutorial for creating interactive graphics and data-driven applications using D3.
Purchase of the print book includes a free eBook in PDF, Kindle, and ePub formats from Manning Publications.
About the Technology
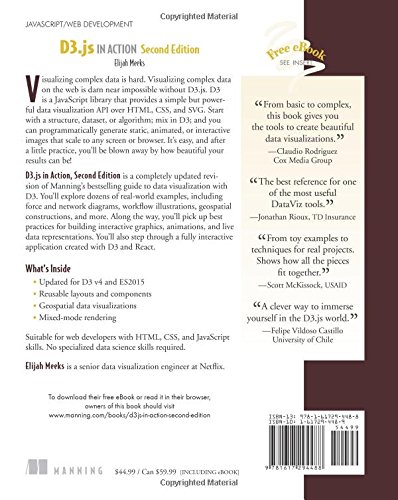
Visualizing complex data is hard. Visualizing complex data on the web is darn near impossible without D3.js. D3 is a JavaScript library that provides a simple but powerful data visualization API over HTML, CSS, and SVG. Start with a structure, dataset, or algorithm; mix in D3; and you can programmatically generate static, animated, or interactive images that scale to any screen or browser. It's easy, and after a little practice, you'll be blown away by how beautiful your results can be!
About the Book
D3.js in Action, Second Edition is a completely updated revision of Manning's bestselling guide to data visualization with D3. You'll explore dozens of real-world examples, including force and network diagrams, workflow illustrations, geospatial constructions, and more. Along the way, you'll pick up best practices for building interactive graphics, animations, and live data representations. You'll also step through a fully interactive application created with D3 and React.
What's Inside
Updated for D3 v4 and ES6
Reusable layouts and components
Geospatial data visualizations
Mixed-mode rendering
About the Reader
Suitable for web developers with HTML, CSS, and JavaScript skills. No specialized data science skills required.
About the Author
Elijah Meeks is a senior data visualization engineer at Netflix.
Table of Contents
PART 1 - D3.JS FUNDAMENTALS
An introduction to D3.js
Information visualization data flow
Data-driven design and interaction
Chart components
Layouts
PART 2 - COMPLEX DATA VISUALIZATION
Hierarchical visualization
Network visualization
Geospatial information visualization
PART 3 - ADVANCED TECHNIQUES
Interactive applications with React and D3
Writing layouts and components
Mixed mode rendering
EAN: 9781617294488
ISBN: 1617294489
Manufacturer: Manning Publications
Brand: Manning Publications
We hope you love the products we recommend! All of products are independently selected by deal-dx editors. Just to let you know, deal-dx may collect a share of sales or other compensation from the links on this page if you decide to shop from them. As an Amazon Associate we earn from qualifying purchases. Prices are accurate and items in stock as of time of publication.
This website uses cookies for the correct display and functionality. Do you also want to take full advantage of the website and accept cookies? About cookies. Accept cookies